Making the WGS Reactor Safe to Run
The follow-up to my reactor design project: instrumentation, cascade control, alarm management, and a full SIL 2 functional safety analysis — all built on top of the UD1 model.
Unit Design 1 produced a working reactor: 998 tubes, 175 kg of Fe-Cr catalyst, 80% CO conversion, 2 bar pressure drop. Unit Design 2 asked the harder question — how do you actually run it safely?
The brief was to design the instrumentation and control system, draw up a full P&ID, and then do a formal Safety Integrity Level (SIL) analysis for the dominant hazard. The reactor operates at ~30 bar and up to 450°C with a syngas feed that’s roughly 20% CO. That combination — high pressure, exothermic reaction, flammable gas — means the safety design isn’t just a box-ticking exercise.
The full code for the FTA calculations is on GitHub.
The Control Problem
Two disturbances dominate reactor performance: inlet temperature and feed composition.
Inlet temperature is the more tractable one. The feed arrives from an upstream compression train whose discharge temperature can drift from its setpoint, directly affecting reaction kinetics and the risk of catalyst sintering. Composition — specifically CO concentration — is trickier. It shifts the reaction equilibrium and conversion, but you can’t measure it in real time with enough accuracy to close a dedicated control loop. The practical solution is periodic lab gas chromatography (every 3–6 hours, ~10 minute turnaround) and manual setpoint adjustments from the control room. It’s imperfect, but it’s what’s available.
Flow rate was deliberately left out of the disturbance list. Both the main syngas feed and the fresh steam feed come directly from feedstock tanks, so the flow rate is effectively set — there’s no meaningful variability to compensate for.
The Three Control Loops
Three loops handle the main control objectives:
Loop 101 — pressure (feedback). A piezoelectric pressure transmitter (PT 101) at the reactor outlet feeds a PI controller that modulates the compressor speed via a variable speed controller (VSC 101). Pressure isn’t directly linked to the temperature disturbances but matters for safety: if temperature control degrades, pressure can build up as a secondary effect. PI rather than PID because the loop is relatively slow and doesn’t need derivative action.
Loops 103 and 104 — cascade temperature control. This is the more interesting design. A cascade was chosen because the reactor has two distinct temperature dynamics: the inlet (fast, directly manipulable via coolant flow) and the outlet (slower, the actual quantity you care about).
Loop 104 is the master. It measures outlet temperature via a thermocouple (TT 104) and uses a PID controller to output a setpoint — not a direct actuation, but an instruction to the slave loop. PID here because the outlet temperature needs tight control and the exothermic reaction can cause overshoot that derivative action helps dampen.
Loop 103 is the slave. It takes the setpoint from TIC 104, measures the inlet temperature (TT 103), and manipulates the coolant flow rate (FCV 103) with a PI controller. The slave loop runs faster than the master, which is what makes the cascade architecture work — disturbances at the inlet get corrected before they propagate to the outlet. Critically, FCV 103 is configured to fail open: if the signal is lost, coolant keeps flowing, which is exactly what you want.
The inherent coupling between temperature and pressure — essentially the ideal gas law at work — means these loops can’t be tuned in isolation. Any temperature swing changes the gas density and therefore the pressure, and vice versa. Getting the controller gains right requires treating them as an interacting system.
The P&ID
The full process and instrumentation diagram:
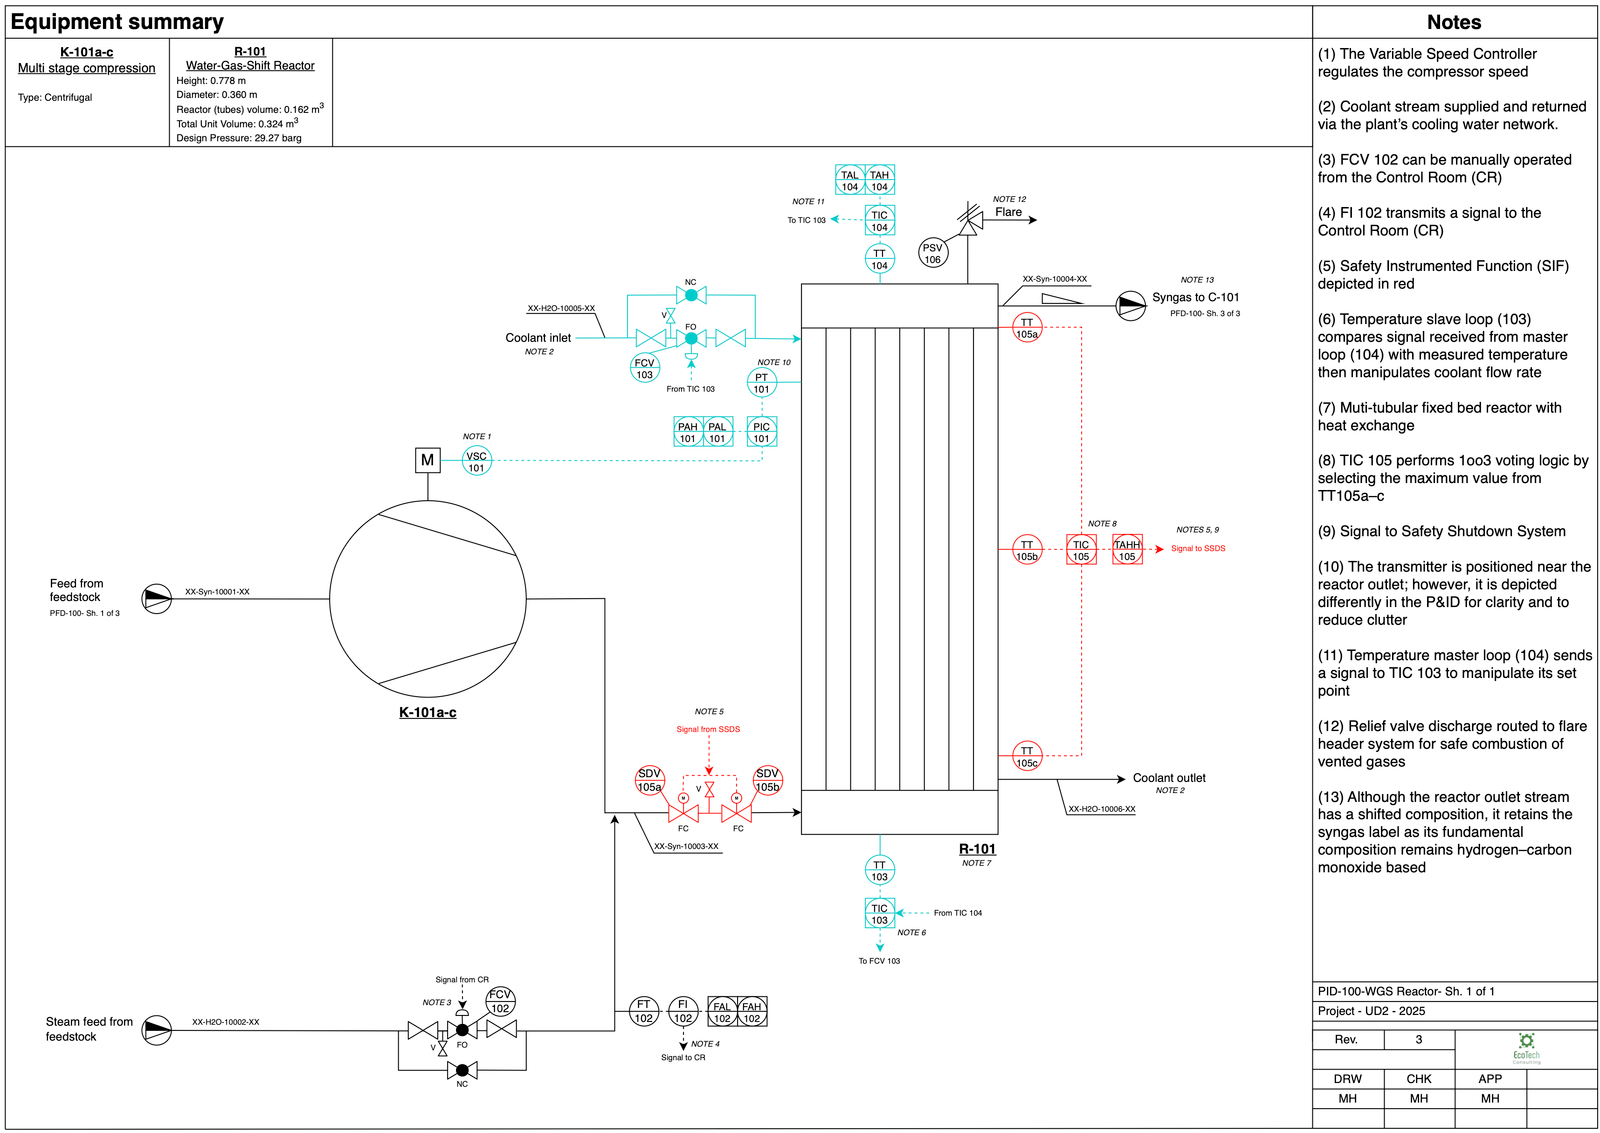
A few things worth pointing out. The SIF (discussed below) is shown in red — it’s a separate layer from the BPCS and sits between the normal control system and the pressure safety valve (PSV 106). The double block-and-bleed arrangement for the shutdown valves (SDV 105a/b) is visible at the bottom of the reactor feed line. Both block valves fail closed; the bleed valve between them opens on shutdown to relieve trapped pressure.
The steam feed valve (FCV 102) fails open, same logic as FCV 103 — losing the signal should default to more steam, not less, to keep the reaction from going into a hot, steam-starved state where methanation picks up.
Alarm Philosophy
Alarm design follows ISA-18.2 rationalisation principles. Each alarm has to clear three gates before it gets included: it must represent a genuine abnormal condition, carry real consequences if ignored, and require an operator action. The goal is to avoid alarm flooding — a control room that cries wolf constantly is worse than one with fewer, well-calibrated alerts.
The temperature alarms (TAL 104, TAH 104) bracket the operating range: the high alarm triggers before the catalyst sintering threshold, the low alarm catches conditions that would depress conversion and potentially activate side reactions like methanation. The pressure alarms (PAL 101, PAH 101) are set for mechanical limits. The steam flow alarms (FAL 102, FAH 102) catch both failure modes — too little steam risks carbon deposition; too much suppresses conversion.
At the top of the alarm hierarchy sits TAHH 105, the high-high temperature alarm that feeds the SIF. This isn’t a BPCS alarm — it’s part of the independent safety layer and triggers an automatic shutdown if reached.
SIL Analysis
Hazard Identification
Three hazards were identified: overpressure (Very High risk), thermal runaway (High), and release of process gases — CO, CO₂, H₂ (Medium). Overpressure was selected as the primary target for SIL analysis. At 30 bar with an exothermic reaction, any failure of the cooling or pressure control systems can escalate rapidly. Historical precedent supports this: the Moerdijk reactor explosion and the Avon hydrocracker runaway are both in the literature as examples of what happens when pressure and temperature controls fail together.
Unprotected Fault Tree
The fault tree for the unprotected system has two main branches joined by an OR gate: failure of the pressure loop (Loop 101), or failure of the temperature cascade (Loops 103 and 104). Either one can initiate overpressure.
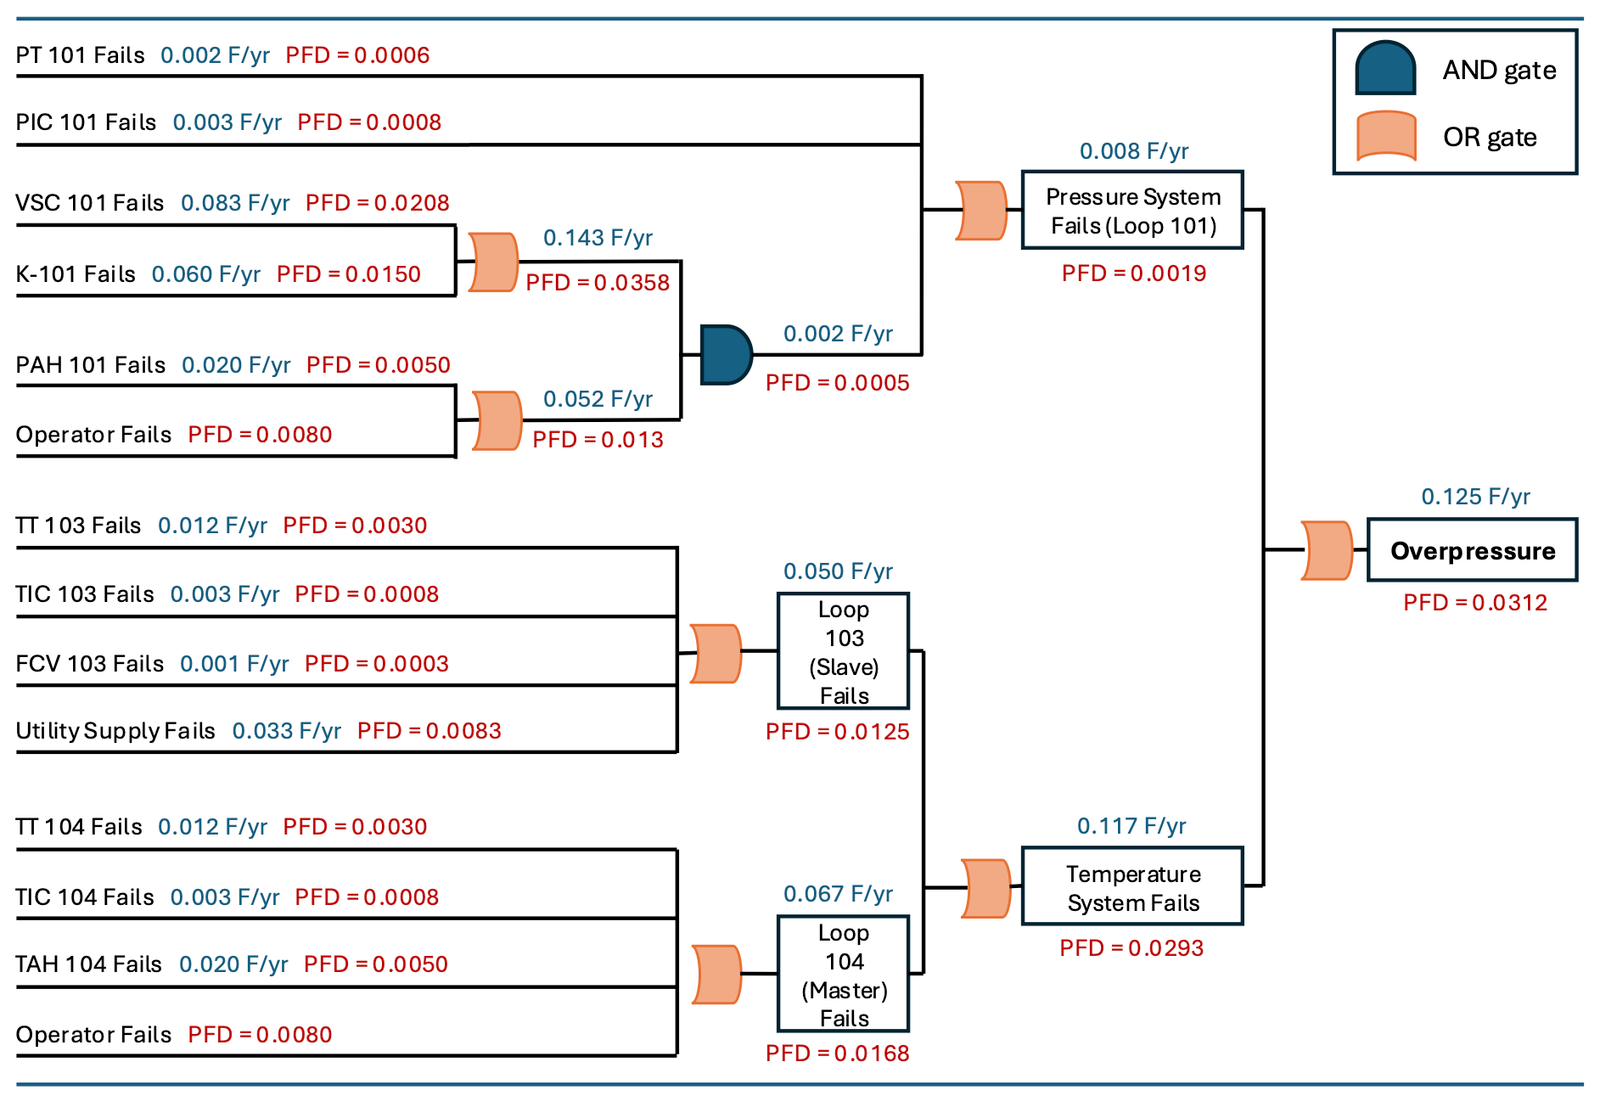
The PFD for each component was calculated using:
where is the dangerous failure rate (set at one-third of the total failure rate from literature) and is the test interval. This formula applies in low demand mode — demand rate below 1 F/yr.
At a six-month test interval, the unprotected top-event PFD is 0.0312, corresponding to a demand rate of 0.125 F/yr. That places it in category W₂, and plugging the risk graph parameters (consequence C_C, exposure F_B, probability of avoidance P_A) into the IEC 61511 risk graph confirms a SIL 2 target — risk reduction by a factor of 100 to 1000 is required.
The temperature cascade is the dominant contributor. The OR gate structure means any single failure among the eight temperature control elements (TT 103, TIC 103, FCV 103, utility supply, TT 104, TIC 104, TAH 104, operator) is sufficient to trigger the top event. That’s an inherently fragile structure for a high-pressure reactor, which is why the SIF is warranted.
Choosing the SIF
Three candidates were considered: temperature monitoring with increased coolant flow, pressure monitoring with shutdown, and temperature monitoring with shutdown.
The first option is too slow if hot spots are intensifying rapidly — adding coolant may not intervene in time. The second reacts late, because pressure changes lag temperature spikes in exothermic systems. The third wins: temperature is the earliest indicator of an emerging hazard, and shutdown is the most decisive response.
The chosen SIF (Loop 105) uses three temperature sensors (TT 105a/b/c) positioned at the reactor inlet, midsection, and outlet. Their signals are aggregated by TIC 105 using 1oo3 voting logic — the maximum reading is selected. This protects against both false trips (a single faulty high reading alone doesn’t trigger shutdown) and missed events (the worst-case location is always monitored). When TAHH 105 fires, it signals the SSDS to close both SDV 105a and SDV 105b simultaneously while the bleed valve opens.
Protected Fault Tree and Final SIL Rating
With the SIF added, the fault tree gains an AND gate at the top: overpressure can only occur if both the BPCS fails and the SIF fails.
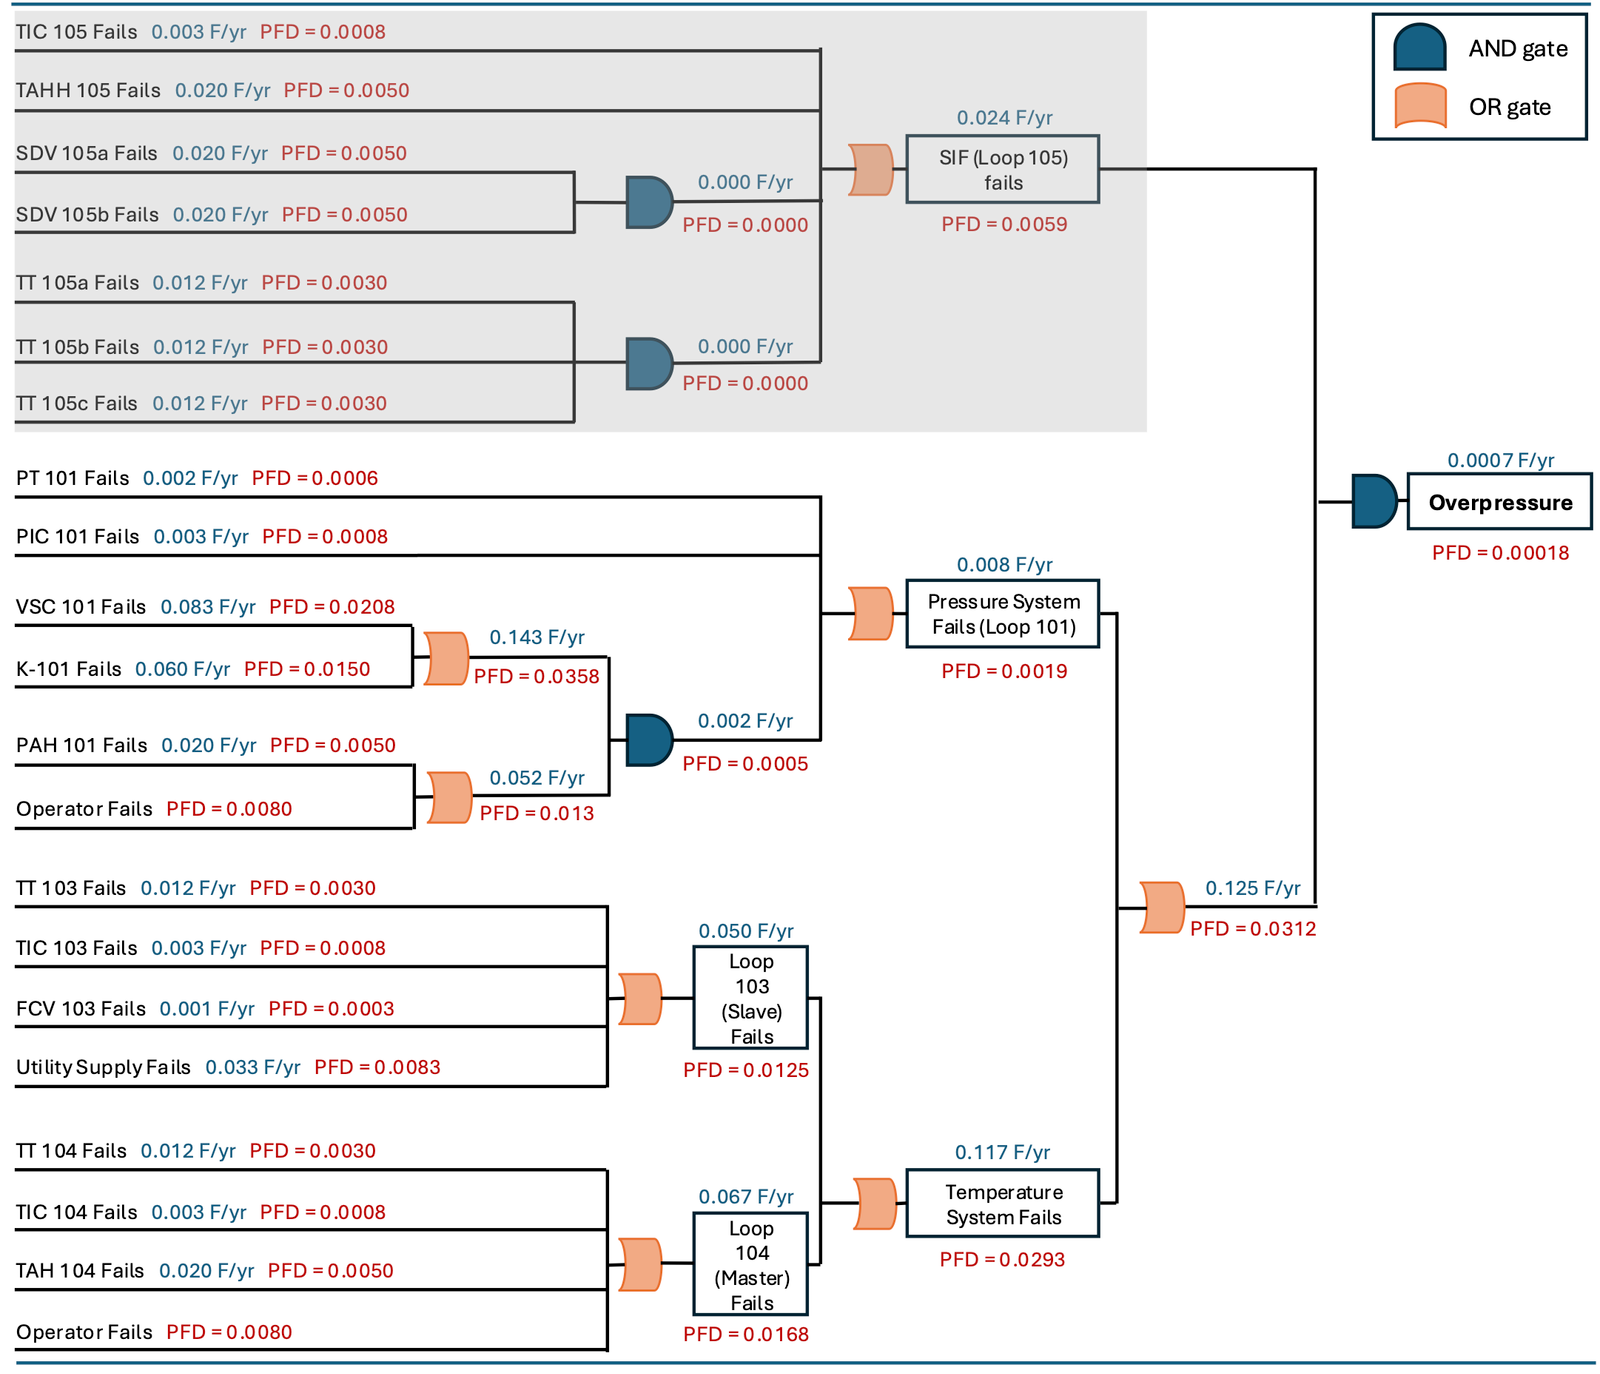
The SIF’s PFD at a six-month test interval is 0.0059, giving:
The protected top-event PFD drops to approximately 0.00018 — a risk reduction factor of about 169, comfortably within the SIL 2 range of 100–1000.
Test Interval Selection
The six-month interval wasn’t arbitrary. I swept test periods from 1 to 24 months to see how the demand rate and SIL rating respond:
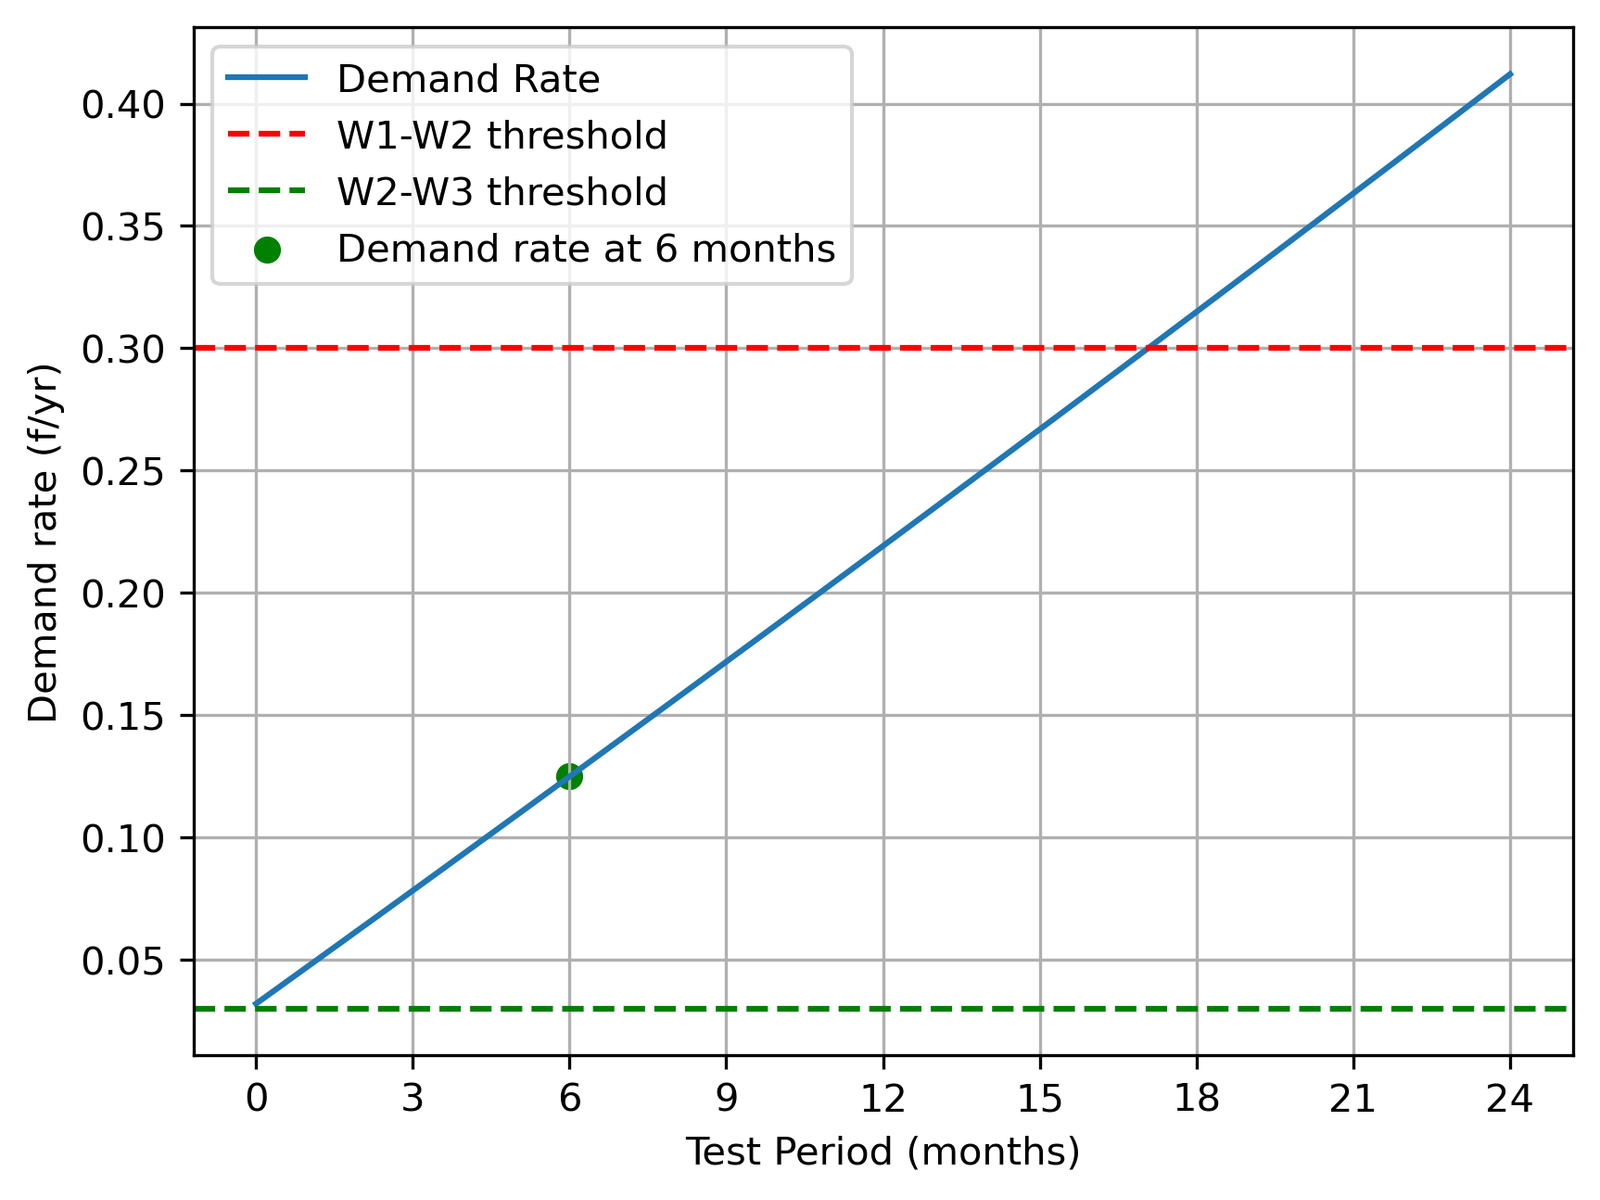
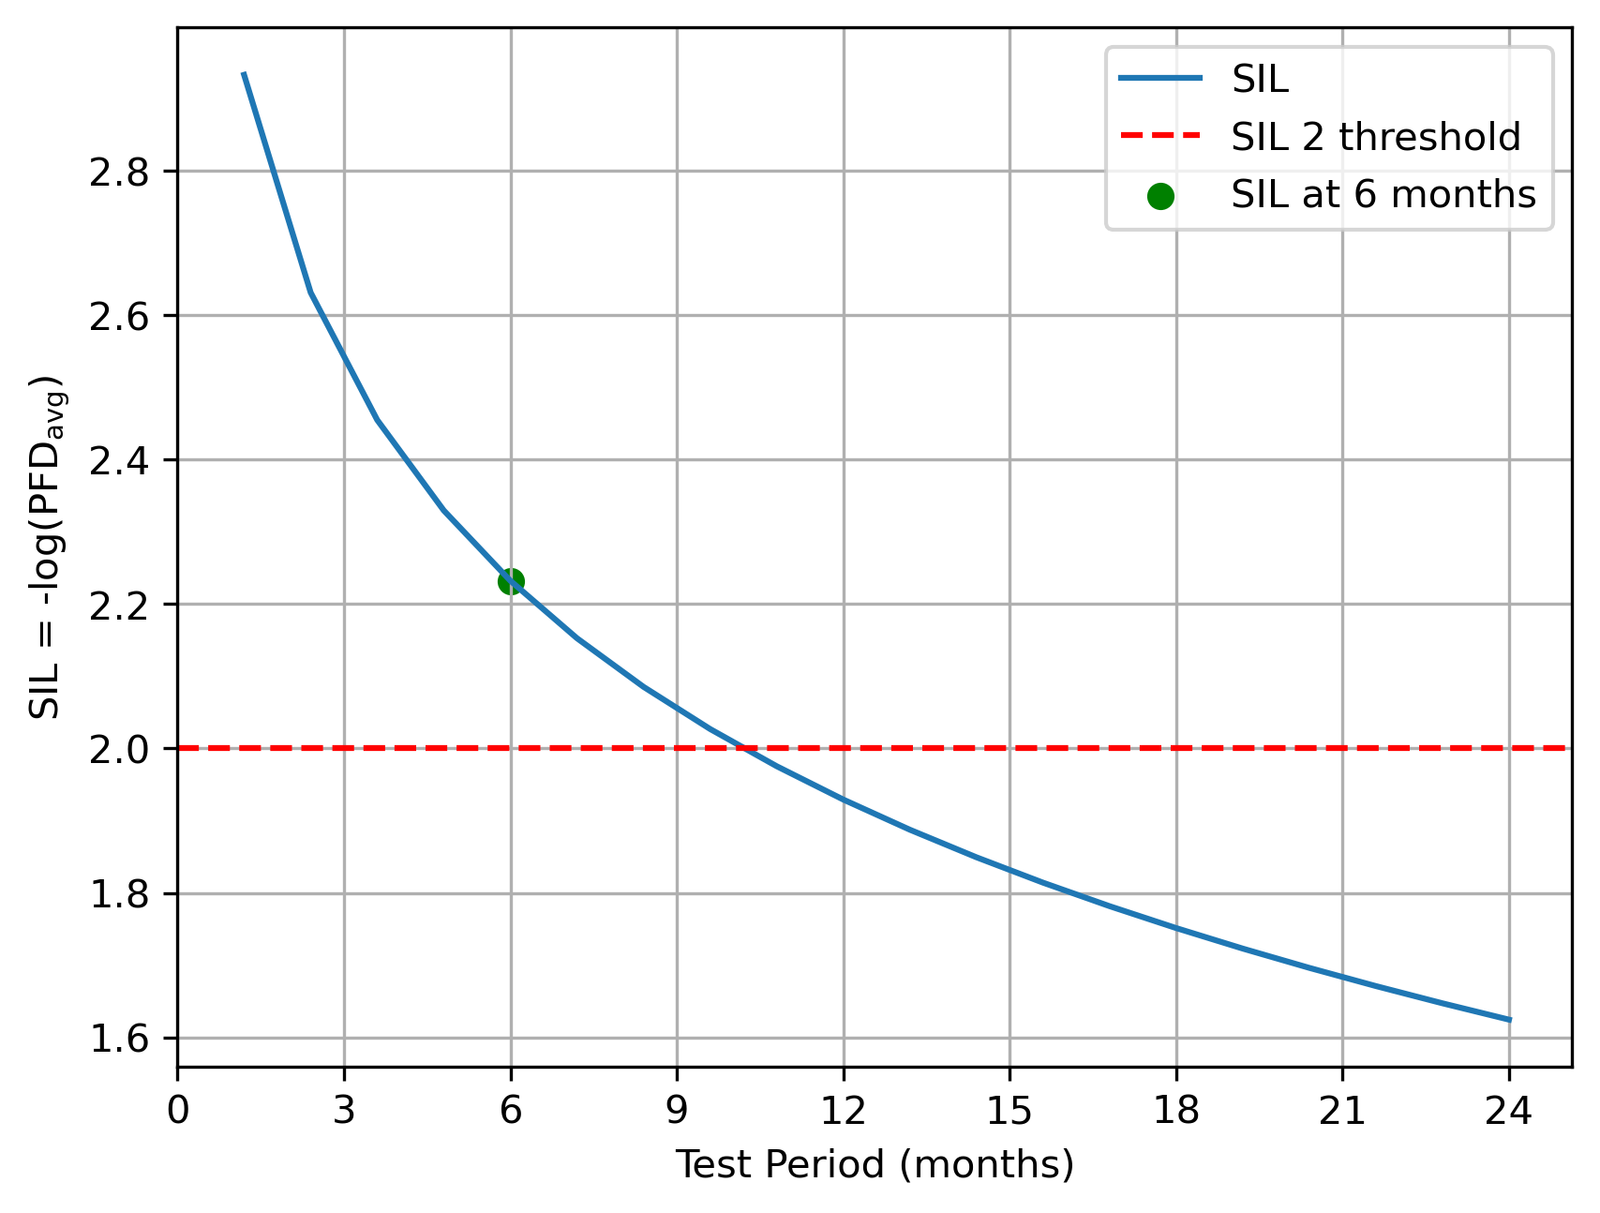
Shorter intervals improve reliability but add maintenance downtime and cost. Intervals beyond 12 months risk leaving dangerous failures undetected. Six months is standard in industry for SIL 2 systems, and the analysis shows it gives a comfortable margin — the SIF holds SIL 2 up to around ten months before the PFD degrades below the threshold.
Caveats on the Failure Data
The failure rates come primarily from Lees’ Loss Prevention in the Process Industries, which is the standard reference — but the data spans 1972–1993. The VSD failure rate in particular is from 1972, which is over 50 years old. Modern variable speed controllers are almost certainly more reliable than that figure suggests, so the analysis is conservative — the right direction for safety work, but worth knowing.
The analysis also assumes independent failures throughout, which underestimates risk when common cause failures (CCFs) are present. A fire simultaneously damaging TT 105a, 105b, and 105c would defeat the 1oo3 architecture. The spatial distribution of sensors partially mitigates this, but a proper beta factor CCF analysis was outside scope.
Results Summary
| Item | Value |
|---|---|
| Control loops | 3 (pressure feedback, cascade temperature) |
| Primary hazard | Overpressure |
| Unprotected top-event PFD | 0.0312 |
| SIL target | 2 |
| SIF architecture | 1oo3 temperature voting + double block-and-bleed |
| SIF PFD (6-month test interval) | 0.0059 |
| SIL achieved | 2.23 |
| Protected top-event PFD | 0.00018 |
| Risk reduction factor | ~169 |
What I’d Do Differently
Quantify common cause failures. The current analysis assumes independent component failures throughout. Sensors sharing a physical location, power supply, or failure mode can fail together in ways that defeat voting logic. A beta factor analysis on TT 105a–c would give a more honest picture of the 1oo3 architecture’s actual reliability.
Get modern failure rate data. The Lees’ dataset is the best publicly available reference, but it’s old. Proprietary failure data from modern DCS vendors would materially change several PFD calculations — particularly for the VSD and alarm systems. The conservative bias means the SIL classification is likely safe, but the actual numbers would shift.
Automate the composition response. The current strategy — lab GC every few hours, manual setpoint adjustment — has a dead time of at least 10 minutes plus operator response lag. A better long-term solution would be an online analyser (near-infrared or process mass spectrometry) feeding a trim controller on the outlet temperature setpoint. The cost is significant, but so is running off-spec until the next GC result.
Extend to a dynamic runaway model. The safety analysis is steady-state. A dynamic model tracking how quickly temperature escalates under different fault scenarios — and whether the SIF response time is fast enough to intervene before the PSV lifts — would give a much more rigorous justification for the SIF architecture. This is standard practice for SIL 3 and SIL 4 systems, and it would be the natural next step if the hazard classification moved up.